Abstract
Tea is an important food drink globally with significant health benefit. However, it consumption is low in Nigeria and sub-Saharan Africa generally. There is dearth of literature on branded tea demand. Hence, household demand for branded tea in southwest, Nigeria was investigated. The study revealed the dominance of Lipton tea among other brands of tea. Demand for herbal tea was higher among older respondents. The study affirmed that the monthly household expenditure share on branded tea in the study area and across the states was low. The monthly household expenditure on complements (sugar, milk and honey) was higher than that of branded teas. The study revealed the influence of price on the expenditure shares of branded teas, its substitutes and complements. Marital status and years of education of respondent influenced the decision to consume branded tea. Expectedly, branded teas exhibited complementary relationships with milk, sugar and honey. The expenditure elasticities of all the branded teas except top tea were positive (normal goods). Improvement in local production and processing of tea locally will bring about its improved consumption. It is recommended that the relevant NGOs should raise the level of awareness on the health benefit of tea which may help to raise the household expenditure on it from the present level. Also, it is imperative for government to put enabling policy in place for tea firms to source tea leaf locally to reduce the price of branded teas as well as create jobs along the tea value chain.
Keywords: Demand for tea, Branded tea, Normal goods, Price elasticities, QUAIDS, Tea complements.
JEL Classification: B21; B22; C01; C1; D11.
Received: 24 February 2021 / Revised: 29 March 2021 / Accepted: 3 May 2021/ Published: 31 May 2021
Contribution/ Originality
The study showed that the demand as well as expenditure on branded tea was low in the Southwest, Nigeria. The preference for herbal tea by the aged was highlighted by the study. The study has increased the existing literature on demand for branded tea in Southwest, Nigeria.
1. INTRODUCTION
Agriculture has been a major contributor to economic growth in developing countries and it is the pillar of regional food security in sub-Sahara Africa. Before independence and in the early 60s, agriculture was the major contributor to national output; it contributed over 60% to the country’s Gross Domestic Product (National Bureau of Statistics, 2010).Apart from providing the means of livelihood to the populace and contributing to the GDP, the importance of agriculture in food production which is essential for the wellbeing of the populace and by extension their productivity cannot be overemphasized (Holder, M. D. (2019). The contribution of food consumption to well-being. Annuals of Nutrition and Metabolism, 74(Suppl. 2), 44–51. Available at: https://doi.org/10.1159/000499147. , 2019). Food is any substance normally eaten or drunk by living things. The term food also includes liquid drinks. Food is the main source of energy and of nutrition for animals and is usually of animal or plant origins (World of Molecules, 2016). According to Australian Government Department of Health (2013) there are six major nutrients in food: carbohydrates (CHO), lipids (fats), proteins, vitamins, minerals and water. Water can be a beverage and a component of many foods, especially vegetables and fruits. All beverages including branded tea contain water when prepared and count toward daily water requirement.
Tea is an aromatic beverage commonly prepared by pouring hot or boiling water over cured or fresh leaves of the Camellia sinensis, an evergreen shrub (bush) native to East Asia. After water, it is the most widely consumed drink in the world (Macfarlane & Macfarlane, 2004; Martin, 2007). Tea production companies in Nigeria operates under monopolistic competition which allows for differentiated products (branding) in terms of packaging, aroma, colour and acclaimed nutritional importance. In monopolistic competition, a firm takes the prices charged by its rivals as given and ignores the impact of its own prices on the prices of other firms (Krugman & Obstfeld, 2008; Poiesz, 2004). Branded tea is different from beverages like Milo, Bournvita and Ovaltine which are cocoa food drinks. Purdie (2019) affirmed that teas contain different rates of caffeine, which are attributed to the length of brewing time, brand, parts of water to tea and serving size. For example, green tea contains less caffeine than black tea. Typical herbal teas do not contain any caffeine. Generally, cocoa drinks contain less caffeine than tea. However, some cocoa products contain more caffeine than some branded teas. Consumption of tea has many nutritional values. Carroll and Wolf (2020) and Food and Agriculture Organisation (2018) highlighted various nutritional importance of tea to include: antioxidants which helps to prevent the body’s version of rust and thus help to keep us young and protect us from damage from pollution. It may reduce the risk of heart attack and stroke. Tea may help with weight loss protect bones and also may boost the immune system.Tea consumption in Nigeria is high among the Hausa in the Northern part of the country. Tea is usually part of their breakfast, lunch and dinner and it is also a beverage to entertain guests despite the extreme weather condition. Moreover, tea is also consumed in the South-west part of Nigeria regardless of the weather condition. Although, unlike their tea drinking counterparts in the North who prefer to drink their tea plain or with sugar or honey, the South-west will usually drink with a lot of creamed milk and sugar just the way the British (whites) drink theirs (Okafor, 2017).
The leading tea producers in the world are the People’s Republic of China, India, Kenya, Sri Lanka and Turkey (FAOSTAT, 2011). World tea production increased by 5.34 and 5.90 million tones in 2013 and 2018 respectively (Annual Bulletin of Statistics, 2019; De Vries, McClafferty, Van Drop, & Weiligmann, 2013). Nigeria was mentioned honorary list without quantity produced among the list tea producing countries in the world (Tea How, 2019). Tea production in Nigeria is on small scale when compared with Kenya and Malawi. The tea cultivation has been neglected over the years. According to Osibo (2010) production of tea in Nigeria is done on the Mambilla Highland in Taraba State at about 1450 above sea level where the raw material (fresh tea leaves) for the black tea processing is found. The large expanse of land in Mambilla plateau suitable for the production of tea has been taking over for residential purposes and livestock production. According to Omolaja and Iremiren (2012) out of the total land area of 394,890ha of Mambilla plateau, tea was cultivated on 1,200ha while 157, 956ha (40% 0f the land area) was used for cattle and other ruminants grazing. The average annual national production is 1,640 tonnes, which meets only 10% of the tea leaf raw material requirement of the processing industry. Hence, the need for the importation of tea leaves to augment the shortfall. Apart from expending the foreign exchange on what can be produced locally, Nigerians are deprived of the employment opportunities associated with its value chain.
According to Olawoyin (2019) as a result of the staggering inflation rate at 18.72% brought about by the economic recession, there is a reduction in the purchasing power of household income. This is in addition to the inability of most state governments to pay workers’ salary or paid half salary to workers as a coping strategy (Vanguard, 2016). The effects of the recession on demand for food cannot be overemphasized. Such effects include a hike in food prices, fall or stagnant household income, low purchasing power, and consequently low demand for food by households. For example, a pack of Lipton tea rose from ₦100 to ₦180. Sessou and Kolawole (2016) reported that prices of food items increased by 100 % from the previous years as a result of the economic recession. The general economic recession challenges facing most households affect the demand and subsequent consumption of food items, branded tea inclusively, and as such, the high household food expenditure may necessitate a review of budget on food by giving preference to some basic food items at the expense of others like tea depending on the importance the household attach to tea consumption. The need for the review of food budgets and its likely effect on tea consumption prompt this study.Also, there is scanty literature on tea research most especially demand branded tea among households in southwest Nigeria.This study, therefore, seeks to contribute to knowledge by providing further evidence on household expenditure share on branded tea, the market share as well as the factors that influenced household preference/expenditure for branded teas. To achieve the objective of the study, the following research questions are raised: What was the expenditure share of households on branded tea? What was the market share of each of the branded tea? Is there a significant difference in the average household expenditure among the states? What are the factors influencing households’ expenditure on branded tea?
2. MATERIAL AND METHODS
2.1. Theoretical Framework and Literature Review
This study is supported by the theory of consumer behaviour. Consumer behaviour theory is based on the basic law of consumption, that is, when aggregate income increases, consumption also increase but by somewhat smaller amount. This is based on the assumptions that spending habits remain the same, political conditions remaining normal and economy being free and perfect.
Several analytical tools have been used in demand analysis, out of which Almost Ideal Demand System (Abdulai, 2012; Iwang, 2014; Motallebi & Pendell, 2013) Linear Approximate Almost Ideal Demand System (LA/AIDS) (Alston, Foster, & Green, 1994; Buse, 1994; Green & Alston, 1991) Double Hurdle model (Akinbode & Dipeolu, 2012; Blundell & Meghir, 1987; Newman, Henchion, & Matthews, 2003) two demand systems models (AIDS and QUAIDS) have been intensively utilised in studies assessing the demand mechanism for food. Studies that used AIDS include Abdulai, Jain, and Sharma (1999); Akinleye (2007); Muhammad-Lawal, Kolawole, Balogun, and Jamiu (2011) while Obayelu, Okoruwa, and Ajani (2009) and Olorunfemi (2013) used the QUAIDS model to analyse food demand in Nigeria. Banks, Blundell, and Lewbel (1997) opined that QUAIDS model is preferred to AIDS model in that it has the property of non-linear Engel function which is more appropriate to household data we considered in this study.
2.2. Analytical Framework of QUAIDS
QUAIDS is derived from a generalization of the PIGLOG preferences which starts from an indirect utility function of the form:
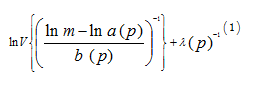
Where[lnm-ln a(p)] = indirect utility function of the PIGLOG demand system (that is, a system with budget shares linear in the log total expenditure) and m = total expenditure,
a (p), b(p) and λ(p) are homogenous of degree zero in prices.
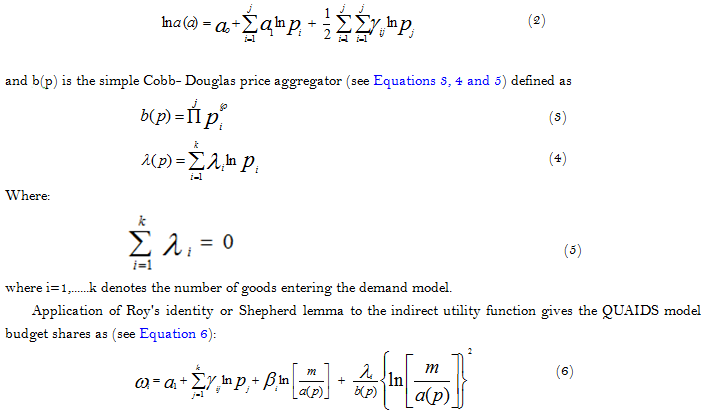
The ln a(p) given in the above Equation 1 has the translog form as shown in Equation 2:
To control for varying preference structures and heterogeneity across households, demographic variables (z) are incorporated into the QUAIDS model through the linear demographic translating method (Pollak & Wales, 1981).
2.3. Estimation of Expenditure Elasiticity, Compensated and Uncompensated Price Elasticities
Elasticity is an important measure in demand analysis. The formulae for elasticities in the QUAIDS are given by Banks et al. (1997). The elasticities were obtained by first differentiating the budget share equation with respect to lnm and lnpj respectively (see Equations 7 and 8) to obtain:
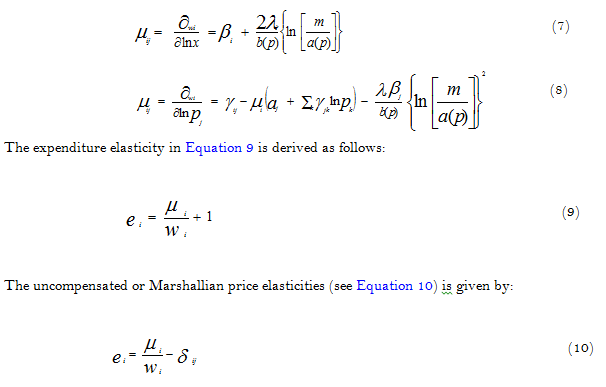
Where δij is the Kronecker delta which is equal to 1when i=j, otherwise δij=0.
Using the Slutsky equation, the compensated or Hicksian price elasticities (see Equation 11):

Equation 11 is derived and used to assess the symmetry and negativity conditions by examining the matrix with elements wi[ecij] which should be symmetric and negative semi definite in the usual way. Equation 11 is calculated and used to assess the symmetry and negativity conditions by examining the matrix with elements wi[ecij] which should be symmetric and negative semi definite in the usual way.
2.4. Description of the Study Area
The study was conducted in Southwest, Nigeria. Southwest is one of the six geo–political zones in Nigeria. It falls within the latitude 6o to the North and latitude 4o to the West and 6o to the East. The zone is made up of six States: Ekiti, Lagos, Ogun, Ondo, Osun and Oyo Figure 1. The zone has a land area of about 114,271 km2, representing approximately 12% of Nigeria total land mass. The rural areas are predominantly agrarian while trading, commerce, manufacturing and banking and administration are common occupations in the urban area. According to National Bureau of Statistics (2007) South West household members consumed more of Eko/Agidi, bread, yam flour, yam tuber, and garri. Tea is mostly consumed plain in rural areas while drinking tea with sugar/honey and milk is common in the urban areas.
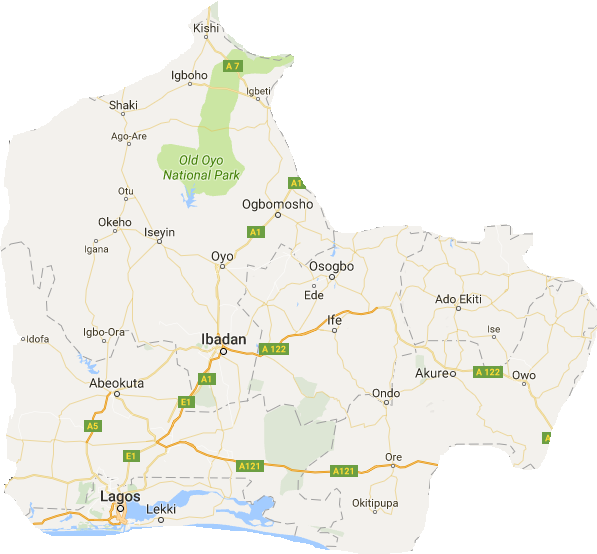
Figure-1. Map of Southwest Nigeria.
2.5. Sample Selection and Data Collection
A multi-stage sampling technique was employed in selecting the sample for the study in order to achieve a representative sample of the research population. In the first stage, three states were randomly selected from the six states in Southwest (Oyo, Lagos and Ekiti states). In the second stage, two Local Government Areas (LGAs) were purposively selected from each state, one LGA from state capital because in the state capital, people of diverse income groups can be found and the second LGA was selected from the rural area. In the third stage, a proportionate to size (2.5%) was used to randomly select respondents from the list of households in each local government area. This amounted to 270 households from the six LGAs. However, only 256 questionnaires with adequate and consistent information were used in the analysis. The distribution of local government areas where data were collected are shown in Table 1.
Table-1. Distribution of local government areas where data were collected.
State |
Urban local government area |
Rural local government area |
Lagos |
Amuwo-Odofin |
Ajeromi |
Ekiti |
Ado-Ekiti |
Irepodun-Ifelodun |
Oyo |
Akinyele |
Egbeda |
Source: Field Survey (2016).
2.6. Data Collected and Utilized
The study utilized primary data. Data were obtained from households spread across urban and rural areas in the study area across the states. A structured questionnaire was used to collect information on socio-economic characteristics (age, household size, educational status of household head, years of education, sex of household head, head of households’ preferred branded tea and monthly income), available brands of tea, household expenditure on branded tea, substitutes to tea (milo, bournvita and ovaltine) and complements to tea (sugar/honey and milk).
2.7. Data Analysis
The analytical tools employed were Descriptive statistics, Probit regression model and the Quadratic Almost Ideal Demand System (QUAIDS). Descriptive statistics used was to profile the socioeconomic characteristics of the respondents in the study area. The descriptive analysis included measure of central tendency (mean and mode), measure of dispersion (standard deviation, variance and skewness) and frequency distribution. Probit regression model (see Equations 12 and 13) was used to determine the factors influencing consumers’ preference for branded tea in the study area. The probit model was implicitly stated as:
Y*= (X1, X2, X3, X4, X5’X6, X7, X8) (12)
Y*=1 if y*>0, 0 if Y*<0 (13)
The explicit form of the model (Equation 14) is stated as:
Where:
Y*represents household that consumes any of the branded tea (Y=1) and household that does not to consume any of the branded tea (Y=0);
X1 represents the sex of household head (Dummy where 1= Male; 0=Female)
X2 represents the marital status of household head (Dummy where 1 = Married; 0 = others)
X3 represents years of education of respondents
X4 represents age (years) of respondent
X5 represents the household size of respondent
X6= price per unit (₦) of branded tea substitute
Where ωi= household’s expenditure share of ith branded tea brands for i=1,2,3 and4; ω1=share of Lipton tea; ω2=share of Top tea; ω3=share of Herbal tea; ω4=share of Green tea; pi=price of ith processed tea brands(N/pack) for i=1,2,3 and 4; p1=price of Lipton tea (N/pack); p2=price of Top tea (N/pack); p3=price of Herbal tea (N/pack); p4=price of Green tea (N/pack); zi=socioeconomic variables; z1=Age of household (years); z2=Marital status of household (1= married, 0 otherwise); z3=household’s size (Head count); εi= error term; and s = branded tea
3. RESULTS AND DISCUSSION
3.1. Socioeconomic Characteristics of the Respondents
The study showed that 61.6% and 38.4% of the respondents that consumed branded teas were male and female respectively. The average age of consumers of branded tea was 44.1 years with the majority being 63years and above at 15.7%.Further disaggregation revealed that herbal tea demand was common among the head of households that were at least 65years old, while respondents within the age bracket of 43-47years consumed other branded tea. The choice of herbal tea may be to cure diseases associated with old age. Also, 76.9% of the respondents were married with an average household size of 5 and the skewness is 0.159. This average household size conforms to NBS (2006) statistics on the average household size in Oyo state and marginally higher than other parts of the southwest, Nigeria. The result further showed that almost all the respondents that consumed branded teas have one form of formal education or the other but the majority (33.6%) had tertiary education (BSc/HND). Among the brands of tea in southwest, Nigeria; Lipton tea enjoyed the highest preference among the consumers (79.6%), this was followed by top tea with 11.6%. Moreover, the study revealed that 6.6% of respondents consumed two brands of tea at a time. The study posited that most respondents (96.5%) consumed branded tea with sweetener or milk. The majority (43%) of the consumers of branded tea consume tea on health grounds with most (79.6%) opting for Lipton tea.
3.2. Disaggregation of Monthly Expenditure (₦) Share on Branded Tea, Substitutes and Complements among States
The breakdown of the average household monthly expenditure share on branded tea showed that Lipton tea has the highest expenditure share (0.0025) among the branded teas in the study area. This means that 0.25% of the household expenditure was spent on branded teas per month. The small percentage may be attributed to low priority accorded to households in the study area which might have been aggravated by the economic recession. Generally, the percentages of total expenditure on branded teas were very low across the brands Table 2.The highest expenditure share recorded by Lipton compared to other brands may be ascribed to high market penetration, use of television advertisement and billboards. The disaggregation of the study area into states also showed that Lipton tea dominated the market in all the states with Oyo State recorded the highest average expenditure share (0.27%). Average household expenditure share in Ekiti, Lagos and Lagos States for top tea, herbal tea and green tea respectively.
Table-2. Average expenditure share of Lipton, top, herbal and green teas on total monthly expenditure on branded tea.
Branded tea |
Total |
Ekiti |
Lagos |
Oyo |
Lipton |
0.0025 |
0.0023 |
0.0026 |
0.0027 |
Top |
0.00036 |
0.00066 |
0.00038 |
0.000051 |
Herbal |
0.000072 |
0.000031 |
0.000072 |
0.00011 |
Green |
0.00041 |
0.00 |
0.00091 |
0.00031 |
Source: Field Survey (2016).
The metropolitan nature of Lagos state coupled with informed buyers that wanted to tap from the health benefit of green tea might have led to the dominance of herbal and green teas. Generally, the expenditure share of Lagos State was the highest for branded teas among the states Table 3.
Table-3. Average expenditure shares of branded tea, their substitutes and complements from total monthly household expenditure on food drinks.
| Food Drinks | Ekiti |
Lagos |
Oyo |
| Branded teas (Lipton, top, herbal and green teas) | 0.0033 |
0.0040 |
0.0032 |
| Substitutes (Milo, Bournvita and Ovaltine) | 0.0031 |
0.0047 |
0.0023 |
| Complements (Sugar, Milk and Honey) | 0.0045 |
0.0066 |
0.0048 |
Source: Field Survey (2016).
The study also revealed that the household expenditure share on complements (sugar, milk and honey) was higher than that of the branded teas across the states. This may not be unconnected with the other needs of these complements by the household aside tea. Sugar and milk are used as complements in custard, garri and pap which make household to spend more on them monthly. Lagos State had the highest monthly household expenditure on branded teas which almost tripled the monthly household expenditure on tea in Ekiti State Table 4.
Table-4. Expenditure share of branded teas on the total monthly expenditure of household.
State |
Expenditure on branded teas (₦) |
Total monthly household expenditure (₦) |
Expenditure share |
Ekiti |
9245 |
4398000 |
0.0021 |
Lagos |
27193 |
9899500 |
0.0027 |
Oyo |
14113 |
8186000 |
0.0017 |
Source: Field Survey (2016).
The little priority given to branded teas is affirmed in Figure 2. Out of the total household expenditure per month on tea, complements and substitutes; only 6.4% was spent on branded teas while complements (milk, sugar and honey) used for other purposes by households had 55.2%
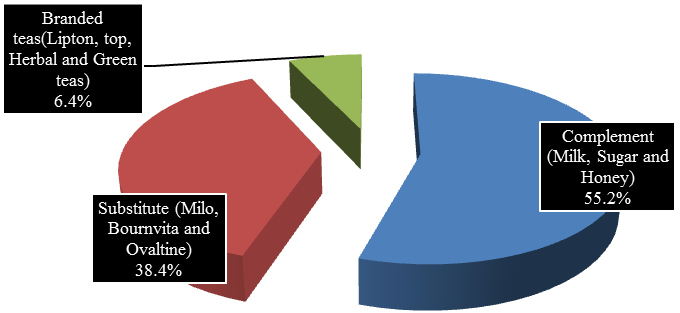
Figure-2. Distribution of expenditure share on branded teas, substitutes and complements.
Source: Field Survey Data (2016).
3.3. Determinants of Expenditure Share of Branded Teas, Their Substitutes and Complements.
Following several studies (Abdulai & Aubert, 2004; Cranfield, 2005; Dybczak, Toth, & Vonka, 2010; Khanal, Mishra, & Keithly, 2015; Lakkakula, Schmitz, & Ripplinger, 2016; Zheng, 2000) QUAIDS specification test was carried out to check whether quadratic specification (QUAIDS) is better than linear specification (AIDS) model Appendix 1. The test of endogeneity indicates the appropriateness of using QUAIDS model in this study compared to AIDS model, therefore, we are inclined to reject the null hypothesis (p<0.05). Also, the Wald test for demographic effect shows that the demographic effect is statistically insignificant on the expenditure shares of branded tea, their substitute and complements (p>0.05). This result may be attributed to the attitude of households generally who often sacrifice the consumption of tea for basic food items (garri, rice, beans, yam among others) bearing in mind the economic recession in the country.
Appendix 2 represents the estimated coefficients of the expenditure share equations. Specifically, 61% (17 out of 28) of the coefficients of the branded teas, their substitutes and complements are statistically different from zero. This indicates that there is a quantity response to movement in relative prices. A change in the price of the commodity leads to change in the expenditure share of each of the food items. Most of the coefficients expectedly have negative relationships with the expenditure shares. This means that for every increase in the price of the commodity, expenditure share reduces. The result shows an improvement over (Bopape & Myers, 2007) that only 32% of the prices of the food items were significant. However, the food commodities used in this study is different from what Bopape and Myers considered. Also, with different food items; almost all the coefficients of the prices of food items considered by Olorunfemi (2013) were significantly different from zero. The general increase in the prices of food items in the country as a result of rising in the inflation rate from 9.3% in October 2015 to 18.3% in October 2016 (Snow, 2016) due to economic recession might have affected the demand for branded teas, their substitutes and complements more than the basic foodstuffs (garri, rice, sorghum, beans, millet, yam among others) which are considered as non-discretionary food items among most Nigerians. While a marginal reduction expenditure share of basic foodstuffs may be adopted as a copying strategy, branded teas, their substitutes and complements may experience a sharp reduction in expenditure share or outright removal from households’ menu list. To most Nigerians during the recession, the demand for branded teas, their substitutes and complements are elastic. This result is corroborated by small amount (3.2%) of monthly household expenditure spent on branded teas, their substitutes and complements in the study area.
Moreover, Appendix 2 shows that just 14% (three out of 21) of the twenty-one (21) coefficients of household characteristics are significantly different from zero. That is, three of the coefficients significantly influenced the expenditure shares of the commodities. This may be due to little importance households attached to branded tea consumption as the prices of food items continue to increase in the country. The negative coefficients of household size and marital status for milk (p<0.05), sugar (p<0.05) and top tea (p<0.01) respectively have an appealing interpretation. In order to feed extra mouths from shrink budget, spending pattern requires adjustment. Specifically, the result shows that as household size increases, expenditure share for milk/milk decreases. The significance of coefficients of household size to expenditure shares of milk and sugar may be attributed to the fact that milk and sugar are used by households as complements to other foods apart from branded teas and their substitutes. For instance, adding sugar to garri (garri is the powdery food material flour made from the tuberous roots of the cassava) solution is very common nowadays. Unlike Bopape and Myers (2007) that considered non-discretionary food items (grains, meat/fish, fruit/vegetable, dairy products, oil/butter/fat and sugar), 69% of the coefficients of household characteristics considered were significantly different from zero.
3.4. Determinants of Households’ Preference for Branded Tea (Marginal Effect)
Appendix 3 presents the result of probit regression analysis used to determine factors influencing households’ preference for branded tea in the study area. The diagnostic part of the result shows that the log likelihood ratio (22.69) is statistically significant (p<0.01). This suggests a relationship between the probability of preference and the suggested explanatory variables. From the table, the coefficient of marital status (p<0.05), years of education (p<0.01) and prices of substitutes (p<0.10) are positively significant. Specifically, the result shows that for every married respondent, the probability of consuming branded tea increase by 9% while every additional year spent in school by respondents will increase the probability of consuming branded tea by 0.09%. This could probably be due to knowledge of the nutritional and perceived health benefits of branded tea. It was observed that the prices of other substitutes like Milo and Bournvita significantly increase the probability of preference for branded tea. This implies that an increase in the price of substitute like Milo will likely increase the probability of preference for branded tea in the study area by 0.1%. Preference for branded tea among married respondents may be attributed to its affordable price compared to beverages as a coping strategy most especially family with large size.
3.5. Expenditure Elasticities for Branded Teas, the Substitutes and Complements
The expenditure elasticities of all the food items except top tea are positive, indicating that six of the food items are normal goods while one (top tea) is considered inferior good (see Appendix 4). For the normal food items, expenditure on the increase as the income increases while for the inferior good; the reverse is the case. Milo, bournvita, sugar and honey show expenditure elasticities of less than one, indicating they are necessities. This means that for every increase in income there is a less proportionate increase in expenditure on the commodities. On the other hand, the expenditure elasticities for Lipton and milk are greater than one, an indication that they are luxurious goods. This means that as income increases, consumers spend more than the proportionate increase on the commodities. The negative expenditure elasticity of top tea implies that as income increases, the amount spent on it reduces.
3.6. Compensated and Uncompensated Own-Price Elasticities for Branded Tea, their Substitutes and Complements
The own-price elasticities for Hicksian or the compensated elasticities show that all the commodities have negative own-price elasticities except top tea just like in uncompensated elasticities (see Appendix 5). Lipton tea (-0.70) has the highest absolute own-price elasticity, followed by sugar (-0.67) and milo (-0.58). The compensated cross-price elasticity shows that top tea and honey, honey and bournvita, honey and top tea are complements while Lipton and top tea, Lipton and bournvita, milo and Lipton, bournvita and milo, sugar and honey are substitutes. However, the result also shows that bournvita and Lipton, bournvita and top tea, milo and top tea, Lipton and bournvita are complements. Using these commodities as complement is common among households in southwest, Nigeria.
Marshallian or uncompensated elasticity is also presented in Appendix 5. The own-price elasticities for all the commodities except top tea were negatives in line with a’priori expectation. Also, the compensated own price elasticities for all the commodities are inelastic. This means that the increase in the price of the commodities leads to a small change in quantity demanded of the commodities. Milk (-0.94) has the highest absolute own-price elasticity, followed by milo (0.84) and Lipton tea. The outlier own-price elasticity of top tea (0.26) may be attributed to its low demand and popularity among consumers. Except for a few commodities, the cross-price elasticities of demand were in agreement with a’priori expectations Appendix 5. Milk and Lipton, milk and top tea, Lipton and sugar, sugar and top tea, top tea and honey, sugar and bournvita have negative cross-price elasticities. This indicates that they are complements. Top tea and Lipton tea have positive cross-price elasticity. Hence, they are substitutes.
4. CONCLUSION
Demand for branded tea, most especially herbal tea was common among the aged respondents while the appreciable percentage of respondents within the age bracket of 43-47years also consumed other branded teas. Branded tea consumption was not considered as priority food based on the marginal amount of household monthly expenditure spent on them. Although marginal, Lipton tea dominated other brands in the study area as well as across the states. The study affirmed the complementary relationship between branded teas and the complements (sugar, milk and honey). As expected in a recessed economy, the price showed significant influence on the expenditure shares of branded teas, its substitutes and complements. From the foregoing, there is a need for increased awareness by non-governmental organization on the health benefit of teas which may help to raise the household expenditure on it from the present level. Also, it is imperative for government to encourage local production of tea and mandate the existing tea firms that currently package already branded teas in Nigeria to source for tea leaves locally. This will help to reduce the price of branded teas as well as create job along the tea value chain; thus reducing unemployment in the country. Other firms producing tea have to intensify their market penetration and create more awareness on their products to reduce the dominance of Lipton tea.
Funding: This study received no specific financial support. |
Competing Interests: The authors declare that they have no competing interests. |
Acknowledgement: All authors contributed equally to the conception and design of the study. |
REFERENCES
Abdulai, A. (2012). Household demand for food in Switzerland: A quadratic almost ideal demand system. Swiss Journal of Economics of Statistics, 138(1), 1-18.
Abdulai, A., Jain, D. K., & Sharma, A. K. (1999). Household food demand analysis in India. Journal of Agricultural Economics, 50(2), 316-327. Available at: https://doi.org/10.1111/j.1477-9552.1999.tb00816.x.
Abdulai, A., & Aubert, D. A. (2004). Cross-section analysis of household demand for food and nutrients in Tanzania. Agricultural Economics, 31(1), 67-79. Available at: https://doi.org/10.1111/j.1574-0862.2004.tb00222.x.
Akinbode, S., & Dipeolu, A. (2012). Double-hurdle model of fresh fish consumption among urban households in South-West Nigeria. Current Research Journal of Social Sciences, 4(6), 431-439.
Akinleye, S. (2007). Nutrient implication of food demand in rural nigerian. Pakistan Journal of Social Sciences, 4(1), 147-152.
Alston, J., Foster, T., & Green, R. (1994). Estimating elasticities with the linear approximate almost ideal demand system: Some Monte Carlo results. The Review of Economics and Statistics, 76(2), 351-356. Available at: https://doi.org/10.2307/2109891.
Annual Bulletin of Statistics. (2019). Global tea market report: Strong growth amid rising challenges. Retrieved from https://www.teaandcoffee.net/feature/22259/2019-global-tea-market-report-strong-growth-amid-rising-challenges/ .
Australian Government Department of Health. (2013). Nutrients. Retrieved from https://www1.health.gov.au/internet/publications/publishing.nsf/Content/canteen-mgr-tr1~nutrients#:~:text=Nutrients%20are%20compounds%20in%20foods,%2C%20Vitamins%2C%20Minerals%2C%20Water.
Banks, J., Blundell, R., & Lewbel, A. (1997). Quadratic Engel curves and consumer demand. Review of Economic Statistics, 79(4), 527-539. Available at: https://doi.org/10.1162/003465397557015.
Blundell, R., & Meghir, C. (1987). Bivariate alternatives to the Tobit model. Journal of Econometrics, 34(1-2), 179-200. Available at: https://doi.org/10.1016/0304-4076(87)90072-8.
Bopape, L., & Myers, R. (2007). Analysis of household demand for food in South Africa, Model selection, expenditure endogeneity, and the influence of socio-demographic effects. Paper presented at the African Econometrics Society Annual Conference. Cape Town, South Africa.
Buse, A. (1994). Evaluating the linearized almost ideal demand system. American Journal of Agricultural Economics, 7(4), 781-793. Available at: https://doi.org/10.2307/1243739.
Carroll, L., & Wolf, D. (2020). Drinking tea may improve your health - here's what to try. Retrieved from: https://www.today.com/series/one-small-thing/top-10-health-benefits-drinking-tea-t81111 .
Cranfield, J. A. L. (2005). Demands for food products across the development spectrum, application of a rank four demand system. Working Paper No. 05/04. Guelph, Ontaro, CanadaL Department of Agricultural Economics and Business, University of Guelph.
De Vries, K., McClafferty, B., Van Drop, M., & Weiligmann, B. (2013). Increasing tea productivity through improved nutrition: A call to action, concept brief. The Netherlands: Printing Company Mostert and van Onderen!
Dybczak, K., Toth, P., & Vonka, D. (2010). Effects of price shocks to consumer demand, estimating the QUAIDS demand system on Czech household budget survey data. CNB Working Paper Series No. 2010/08. Czech: Czech National Bank.
FAOSTAT. (2011). Crops. Food and agriculture organization of the United Nations. Retrieved from: http://www.fao.org/faostat/en/#data/QC/visualize .
Food and Agriculture Organisation. (2018). The FAO intergovernmental group (IGG) on tea. Retrieved from http://www.fao.org/economic/est/est-commodities/tea/tea-meetings/tea23/en/ .
Green, R., & Alston, J. (1991). Elasticities in AIDS models: A clarification and extension. American Journal of Agricultural Economics, 73(3), 874-875. Available at: https://doi.org/10.2307/1242842.
Holder, M. D. (2019). The contribution of food consumption to well-being. Annuals of Nutrition and Metabolism, 74(Suppl. 2), 44–51. Available at: https://doi.org/10.1159/000499147. , M. D. (2019). The contribution of food consumption to well-being. Annuals of Nutrition and Metabolism, 74(Suppl. 2), 44–51. Available at: https://doi.org/10.1159/000499147.
Iwang, R. (2014). Household demand for fish in Delta state, Agbor. Journal of Science and Science Education (AJOSSE), 5(2), 45-52.
Khanal, A. R., Mishra, A. K., & Keithly, W. (2015). Heterogeneity in food demand among rural Indian households: The role of demographics. Canadian Journal of Agricultural Economics, 64(3), 1-28. Available at: https://doi.org/10.1111/cjag.12094.
Krugman, P., & Obstfeld, M. (2008). International economics: Theory and policy (8th ed., pp. 782). USA: Prentice Hall.
Lakkakula, P., Schmitz, A., & Ripplinger, D. (2016). US sweetener demand analysis: A QUAIDS model application. Journal of Agricultural and Resource Economics, 41(3), 1-16.
Macfarlane, A., & Macfarlane, I. (2004). The empire of tea (pp. 320). New York, USA: The Overlook Press.
Martin, L. C. (2007). Tea: The drink that changed the world. Vermont, USA: Tuttle Publishing.
Motallebi, M., & Pendell, D. (2013). Estimating an almost ideal demand system model for meats in Iran. Paper presented at the Agricultural and Applied Economics Association’s 2013 AAEA and CAES Joint Annual Meeting, August 4 – 6. Washington, DC, USA.
Muhammad-Lawal, A., Kolawole, F., Balogun, M., & Jamiu, A. (2011). Food demand analysis among rural households in Oyo state, Nigeria. International Journal of Food, Agriculture and Veterinary Sciences, 1(1), 45-50.
National Bureau of Statistics. (2007). Agricultural survey report 1994/95–2005/06. Abuja: National Bureau of Statistics.
National Bureau of Statistics. (2010). The Nigerian poverty profile (pp. 31). Abuja: National Bureau of Statistics.
Newman, C., Henchion, M., & Matthews, A. (2003). A double-hurdle model of Irish household expenditure on prepared meals. Applied Economics, 35(9), 1053-1061. Available at: https://doi.org/10.1080/0003684032000079170.
Obayelu, A. E., Okoruwa, V. O., & Ajani, O. I. Y. (2009). Cross-sectional analysis of food demand in the North Central, Nigeria: The quadratic almost ideal demand system (QUAIDS) approach. China Agricultural Economic Review, 1(2), 173-193. Available at: https://doi.org/10.1108/17561370910927426.
Okafor, O. (2017). Tea in Nigeria. Retrieved from: https://www.sunnewsonline.com/tea-in-nigeria/ .
Olawoyin, O. (2019). Nigeria’s inflation rate increases, hits 18.72 per cent. Retrieved from: https://www.premiumtimesng.com/news/headlines/223589-nigerias-inflation-rate-increases-hits-18-72-per-cent.html .
Olorunfemi, S. (2013). Demand for food in Ondo state, Nigeria: Using quadratic almost ideal demand system. Journal of Business Management and Economics, 4(1), 1-19.
Omolaja, S. S., & Iremiren, G. O. (2012). Tea improvement in Nigeria. In Global tea breeding. Advanced topics in science and technology in China. Berlin: Springer.
Osibo, O. (2010). NEPC assures on tea industry’s revival in Vanguard News. Retrieved from: www.vanguardngr.com/2010/11/assures-on-tea-industry’s-revival/ . [Accessed November 25, 2010].
Poiesz, T. B. (2004). The free market illusion psychological limitations of consumer choice. Review of Business and Economic Literature, 49(2), 309-338.
Pollak, R. A., & Wales, T. J. (1981). Demographic variables in demand analysis. Econometrica, 49(6), 1533-1551. Available at: https://doi.org/10.2307/1911416.
Purdie, J. (2019). Caffeine differences in coffee, tea and cocoa. Retrieved from https://www.livestrong.com/article/533349-caffeine-differences-in-coffee-tea-cocoa/ .
Sessou, E., & Kolawole, J. (2016). Nigerian groans as prices of foodstuff skyrocket. Retrieved from www.vanguardngr.com/2016/11/nigerians-groans-prices-food .
Snow, J. (2016). Nigeria, Inflation rate tops 18.5 in November. Retrieved from https://nairametrics.com/2016/12/15/nigerias-inflation-rate-tops-18-5-in-november-2016/.
Tea How. (2019). Where is tea grown - the top 62 countries, and quantities. Retrieved from: https://teahow.com/where-is-tea-grown/.
Vanguard. (2016). BudgIT: 33 States cannot pay salaries. Retrieved from https://www.vanguardngr.com/2016/11/budgit-33-states-cant-pay-salaries/ .
World of Molecules. (2016). Food molecules. Retrieved from https://www.worldofmolecules.com/foods/ .
Zheng, Z. (2000). Food demand in urban China (pp. 201). Oklahoma, USA: Oklahoma State University Press.
Appendix-1. Results of test for QUAIDS specification, endogeneity and demographic effects.
| Test | Statistic |
Degree of freedom |
p-value |
| QUAIDS specification: LR value | 49.22 |
6 |
0.00001 |
| Demographic effect(c2 score) | 8.34 |
6 |
0.2143 |
| Expenditure endogeneity (Wu-Hausman: F-value) | 0.9373 |
(7, 250) |
0.478 |
| Lambda Wald (c2 score) | 125.03 |
6 |
0.00001 |
Source: Field Survey (2016).
Appendix-2. Determinants of expenditure share of branded teas, their substitutes and complements.
| Variable | Lipton tea |
Top tea |
Milo |
Bourvita |
Milk |
Sugar |
Honey |
| Constant | 0.1545*** |
-0.0027 |
0.3003*** |
0.1103* |
0.8226*** |
0.0345 |
-0.4195*** |
(0.0555) |
(0.0200) |
(0.0620) |
(0.0572) |
(0.0747) |
(0.0421) |
(0.0575) |
|
| Price coefficients | |||||||
| ln Price of Lipton | 0.0165*** (0.0028) |
||||||
| ln Price of Top tea | -0.0003 |
0.0096*** |
|||||
(0.0008) |
(0.0011) |
||||||
| ln Price of Milo | -0.0046* |
-0.0016* |
0.0443*** |
||||
(0.0025) |
(0.0009) |
(0.0443) |
|||||
| ln Price of Bourvita | -0.0068*** |
0.0002 |
-0.0066** |
0.0410*** |
|||
(0.0022) |
(0.0009) |
(0.0029) |
(0.0034) |
||||
| ln Price of Milk | 0.0023 |
-0.0050*** |
-0.0070 |
-0.0178*** |
0.0896*** |
||
(0.0045) |
(0.0019) |
(0.0048) |
(0.0051) |
(0.0106) |
|||
| ln Price of Sugar | -0.0009 |
0.0008 |
-0.0014 |
-0.0003 |
-0.0922** |
0.0215*** |
|
(0.0018) |
(0.0009) |
(0.0020) |
(0.0018) |
(0.0041) |
(0.0022) |
||
| ln Price of Honey | -0.0061 |
-0.0036 |
-0.0234*** |
-0.0098 |
-0.0531*** |
-0.0104* |
0.1064*** |
(0.0074) |
(0.0025) |
(0.0074) |
(0.0071) |
(0.0081) |
(0.0057) |
(0.0112) |
|
| Expenditure and Expenditure squared | |||||||
| lnEXPD | -0.0002 |
0.0005** |
0.0018*** |
0.0017*** |
0.0003 |
0.0018*** |
-0.0059*** |
(0.0006) |
(0.0002) |
(0.0006) |
(0.0006) |
(0.0007) |
(0.0004) |
(0.0007) |
|
| lnEXPD2 | 0.0093 |
0.0010 |
0.0120* |
0.0091 |
0.0656*** |
0.00103 |
-0.1153*** |
(0.0104) |
(0.0037) |
(0.0105) |
(0.0100) |
(0.0114) |
(0.0076) |
(0.0083) |
|
| Households’ characteristics | |||||||
| AgeHH | -0.0000 |
0.0000 |
0.0001 |
0.0000 |
-0.0000 |
0.0000 |
-0.0000 |
(0.0000) |
(0.0000) |
(0.0000) |
(0.0000) |
(0.0001) |
(0.0000) |
(0.0000) |
|
| MarstHH | 0.0005 |
-0.0009*** |
0.0006 |
-0.0004 |
-0.0000 |
-0.0001 |
0.0003 |
(0.0009) |
(0.0003) |
(0.0015) |
(0.0011) |
(0.0014) |
(0.0006) |
(0.0009) |
|
| HHsz | 0.0001 |
0.0001 |
0.0001 |
0.0000 |
-0.0009** |
0.0004** |
0.0002 |
(0.0002) |
(0.0000) |
(0.0004) |
(0.0003) |
(0.0004) |
(0.0002) |
(0.0002) |
|
Note: ***, **, * indicate level of significance at 1%, 5% and 10% respectively. Standard errors are in parenthesis.
Source: Data analysed (2016)
Appendix-3. Determinants of households’ preference for branded tea.
| Variable | Coefficient |
Std. Error |
Z |
slope |
| Constant | -0.4686 |
0.5400 |
-0.87 |
|
| Sex of respondent | 0.0189 |
0.2341 |
0.08 |
0.0028 |
| Marital status | 0.5237** |
0.2636 |
1.99 |
0.0926 |
| Age of respondent | -0.0006 |
0.0085 |
-0.07 |
0.0001 |
| Years of education | 0.0670*** |
0.0200 |
3.34 |
0.0099 |
| Household size | 0.1280 |
0.2136 |
0.60 |
0.0188 |
| Price of substitute | 0.0006* |
0.0003 |
1.96 |
0.0001 |
Note: ***indicates significance at 1%, ** indicates significance at 5%, * indicates significance at 10%.
Source: Data analysed (2016).
Appendix-4. Expenditure elasticities for branded teas, their substitutes and complements.
Variable |
Expenditure elasticity |
Lipton tea |
1.1802 |
Top tea |
-0.0250 |
Milo |
0.9799 |
Bournvita |
0.7621 |
Milk |
1.1238 |
Sugar |
0.7436 |
Honey |
0.7801 |
Source: Data analysed (2016).
Appendix-5. Own- and- cross-price elasticities of branded tea and substitutes.
| Variable | Lipton tea |
Top tea |
Milo |
BO |
Milk |
Sugar |
Honey |
| Marshallian /Uncompensated Elasticity | |||||||
| Lipton tea | -0.7787 |
0.0022 |
-0.1306 |
-0.1019 |
-0.1545 |
-0.0145 |
-0.0022 |
| Top tea | 0.0979 |
0.2648 |
-0.0071 |
-0.0351 |
0.0780 |
0.0408 |
-0.4140 |
| Milo | -0.0183 |
-0.0076 |
-0.8436 |
-0.0299 |
-0.0391 |
-0.0128 |
-0.0286 |
| Bournvita | -0.0543 |
-0.0092 |
-0.0412 |
-0.5099 |
-0.0656 |
-0.0244 |
-0.0573 |
| Milk | -0.0192 |
-0.0072 |
-0.0633 |
-0.0420 |
-0.9424 |
-0.0249 |
-0.0248 |
| Sugar | 0.0153 |
-0.0015 |
0.0147 |
-0.0261 |
0.0150 |
-0.7218 |
-0.0392 |
| Honey | 0.0220 |
-0.0478 |
-0.0551 |
-0.0636 |
-0.0117 |
-0.0388 |
-0.5852 |
| Hicksian/Compensated Elasticity | |||||||
| Lipton tea | -0.7021 |
0.1080 |
0.1885 |
-0.0066 |
0.3599 |
0.0689 |
0.0806 |
| Top tea | 0.0962 |
0.2646 |
-0.0139 |
-0.0372 |
0.0671 |
0.0390 |
-0.4158 |
| Milo | 0.0453 |
-0.0004 |
-0.5786 |
0.0492 |
0.3880 |
0.0563 |
0.0401 |
| Bournvita | -0.0048 |
-0.0036 |
0.1648 |
-0.4483 |
0.2665 |
0.0294 |
-0.0039 |
| Milk | 0.0538 |
0.0010 |
0.2405 |
0.0487 |
-0.4526 |
0.0545 |
0.0541 |
| Sugar | 0.0636 |
0.0039 |
0.2157 |
0.0340 |
0.3391 |
-0.6692 |
0.0129 |
| Honey | 0.0727 |
-0.0421 |
0.1559 |
-0.0006 |
0.3284 |
0.0163 |
-0.5305 |
Source: Data analysed (2016).
Views and opinions expressed in this article are the views and opinions of the author(s), International Journal of Sustainable Agricultural Research shall not be responsible or answerable for any loss, damage or liability etc. caused in relation to/arising out of the use of the content. |