Abstract
The main objective of the study is to recognize the major factors influencing the capital structure of the textile firms and to identify the association among them from the context of Bangladesh. The researchers reviewed different conditional theories of capital structure before identifying the determinants of the textile firms. For this purpose, panel data for A-category listed textile companies of the Dhaka Stock Exchange were selected. The study developed multiple regression models for the period 2008 to 2017. Key -independent variables include firm profitability, tangibility, growth, age, liquidity and Size. Leverage ratio was used as the dependent variable. The study explored that profitability; firm size and liquidity have significant positive relationship with the debt ratio, which is consistent with the Trade-off theory. On the other hand, tangibility, growth rate and age are not significantly related with the said ratio. The findings of this study will help financial managers to make the right decisions on fund borrowing and equity financing. Then they can use borrowing in a proper way to support the market value of their companies.
Keywords: Capital structure, Trade-off theory, Leverage, Profitability, Tangibility, Textile industry, Bangladesh.
JEL Classification: G30; G32; L67.
Received: 19 May 2020 / Revised: 22 June 2020 / Accepted: 24 July 2020/ Published: 17 August 2020
Contribution/ Originality
This study is one of the very few studies which have investigated the direct relationship of determinant factors with the debt maturity of the listed textile companies in the stock exchange by using panel data analysis.
1. INTRODUCTION
The capital structure of a company means the mixture of sources of funds from which the assets of a company are composed. Debt and equity are the major elements of capital structure. Decisions about debt and equity allow the company to maximize share value and the wealth of the firm. The right capital structure is necessary for the firm’s survival as well as its financial success. Every company has to seek the optimal debt-equity mix. There is a lot of published literature about the determinants of capital structure. Yet the question of what determines a firm’s optimal capital structure remains a subject of debate.
Also, optimal capital structure, and the factors which ultimately determine it, may differ by industry and even by country. No published article has yet considered all possible determining factors at one time. That is the contribution of this article. We need an overarching theory that managers can use to build their capital structures in an optimal and informed way. This article will present such a theory for the textile industry in Bangladesh. Other researchers can use this article as a model in developing theories for other industries in Bangladesh or in other countries.
There are lots of paper about determinants of capital structure in the context of Bangladesh and international. This study has been occurred previously internationally and nationally. This study includes a panel data set of 10 listed A-category textile companies on the Dhaka Stock Exchange for a period of 10 years (2008-2017). Their decisions on debt and equity are examined to determine how leverage, debt and equity are related among Bangladesh textile producers. However due to change of time risk factor, stock market behavior changes. Inefficient market, manipulated imports and exports, rumors and poor knowledge of stock market and huge money laundering affect the determinants of capital structure. So, this research is needed to reflect those factors. Each and every variable used in this study has significant effect on leverage ratio.
This study is unique because included factors that no other study has considered. In the present study the researcher’s wants to show the fixed effect and random effect model. This paper seeks to redress this gap.
2. OBJECTIVES OF THE STUDY
The purpose here is to examine the relationship between determining factors of capital structure and the financial risk of the Bangladesh textile industry. Specifically, the objectives are:
- To identify the major variables influencing debt and equity choices in Bangladesh textile firms.
- To apply accepted theories of debt-equity decision-making to see whether this helps to explain how leverage is decided in the textile industry of Bangladesh.
- To consider correlations between leverage ratio and the firm-specific variables which are profitability, tangibility, growth, age, liquidity, and size.
3. CAPITAL STRUCTURE THEORY
Capital structure theory describes how the debt-equity ratio, capital cost and the overall value of a company relate. There exists no perfect theory to apply in deciding a company’s mix of borrowing and shareholding. Rather theories on these issues remain controversial. As the major theories contradict each other, none of these theories prevails. So this research is needed.
Two longstanding alternatives for companies in making their decisions on borrowing and share issue (Durand, 1952) have long been the “net income approach” and the
“net operating income approach”. Focusing on net income approach, the manager does not consider interest rates or shareholder dividends in making borrowing and share issue decisions. Focusing on net operating income approach, the increases in equity costs and leverage are assumed to have a linear relationship. Classically, Solomon (1963) as leverage increases, capital cost falls and the value of the firm increases until one reaches a level of borrowing which, for a given company, is considered “prudent” After this minimax solution (minimum cost for maximum value), further borrowing will only cause the value of the company’s shares to decrease as capital costs rise.
Supporting the focus on net operating income approach, Modigliani and Miller (1958) introduced the capital structure irrelevancy propositions. Given a perfectly-competitive capital market, no transaction costs and no bankruptcy costs, with perfect information: they deduced the following conditions:
- Companies and individuals can borrow at the same interest rate.
- Taxes and investment are not affected by financing.
- Without regard to taxes, neither a firm’s market value nor the cost of capital is correlated with the debt-equity mix of the firm.
From this theory, Modigliani and Miller (1958) deduced the following propositions:
- The value of a firm is independent of its capital structure.
- The cost of equity for a leveraged firm is equal to the cost of equity for an unleveraged firm plus an added premium for financial risk.
So Modigliani and Miller’s propositions imply that, as leverage increases while the burden of individual risks is shifted between different investors’ classes, total risk is conserved and hence no extra value of companies is created.
In Modigliani. and Miller (1963) published another paper which included the effect of taxes and high-risk debt in their 1958 theory. They concluded that leveraged company will be more valuable than an unleveraged company because the interest on company debt can be deducted from the company’s corporate income tax liability. That is how debt-equity decisions could impact a company’s value. As per their observation, an optimal capital structure would be zero equity and all financing by debt. Such a company’s large debt burden would simply be written off against tax liability, but in the real world, companies never would use such a strategy because of another variable not included in Modigliani and Miller’s theory: the cost of bankruptcy. High bankruptcy costs make the perfect strategy in Modigliani and Miller’s model a high-risk strategy.
Later theories try to remove the imperfections in Modigliani and Miller’s theories include the Static Trade-off theory, Agency Costs theory, Signaling Theory and Pecking-Order theory.
Trade-off theory, Kraus and Litzenberger (1973) conceives of a company’s optimal debt ratio as a trade-off between the advantages and disadvantages of using debt. To calculate these advantages and disadvantages, they consider the tax deductibility of interest payments and the cost of bankruptcy. Kraus and Litzenberger conclude that debt is preferable until the probability of bankruptcy is equal to the tax advantage of interest payments.
Jensen and Meckling (1976)’s Agency Costs Theory advocates that an optimal debt-equity mix can be achieved by increasing the managers’ ownership of the company. Such a solution induces managers to minimize agency costs by transferring some of the companies’ risk to them personally.
Signaling Theories, developed by Ross (1977)states that managers decide leverage as a signal to the market. These theories assume asymmetric information between the market and the managers. Debt is a signal of high future performance and cash flows to repay it. According to Ross, investors take larger levels of debt as a signal of a higher-quality company, raising the company’s share price and, thus its value. The result is that, using more debt, the company finds it easier to raise capital so less debt is needed in the long-term.
Pecking Order Theory, developed by Myers and Majluf (1984) states that, when a company is going to raise capital, managers prefer financing that comes from, in the following order:
1. Internal funds (retained earnings).
2. Debt.
3. Issuing new equity as a last resort, when it is no longer sensible to issue any more debt.
4. LITERATURE REVIEW
4.1. International Evidence
Rajan and Zingales (1995) found that size, growth, profitability and tangible assets determined how debt and equity issue decisions were made by American companies.
Bevan and Danbolt (2002) found that large British companies, having high growth potential used less bank debt than small companies did.
In Pakistan, Mazhar and Nasr (2010) and Shah and Hijazi (2004) found that earnings volatility, profitability, non-debt tax shield asset tangibility, size and growth were significantly correlated with decisions on leverage.
In Nepal, Baral (2004) found operating leverage, dividend payout ratio; business risk, growth rate and size were the major determinants of leverage ratio, with a positive correlation. Debt service capacity and profitability were significant but had a negative correlation with leverage ratio.
Vasiliou, Daskalakis, and Eriotis (2006) found that the significant variables influencing the decisions of Greek companies on leverage were financial distress, market timing and competitiveness. Rajan and Zingales (1995) conducted a trans-national study of companies across developed countries. They found that companies in the G-7 countries made decisions on debt and equity in a similar way. They also found that firm size was not significant as a determiner of leverage decisions.
Booth, Aivazian, Demirguc-Kunt, and Maksimovic (2001) examined the factors of capital structure across developing & developed countries. The study shows that the factors are similar & they affect the capital structure in a similar way for both developed and developing countries.
Buferna, Bangassa, and Hodgkinson (2005) found that four variables related to leverage decisions in a developing country: profitability, growth, tangibility and size. Both the agency cost theory and the static trade-off theory found support in Bufema’s study of Libyan companies’ leverage decisions.
4.2. Evidence from Bangladesh
Chowdhury (2004) was one of the first studies of Bangladeshi companies’ capital structure. Chowdhury (2004) research was comparative, looking at Bangladeshi and Japanese companies. Chowdhury (2004) used the agency cost model. He concluded that agency cost of debt, profitability, growth rate, operating leverage and bankruptcy risk were the significant factors for leverage decisions in both countries.
Lima (2009) studied the pharmaceutical industry in Bangladesh. Operating leverage, growth rate, debt service capacity and tangibility had a positive correlation with capital structure. Bankruptcy risk and agency cost of equity showed a negative correlation to debt ratios.
Sayeed (2011) used cross section random effects model for panel data to explore the determinants of capital structures of selected Bangladeshi listed companies. Agency cost and debt tax shield (e.g. depreciation) had a negative correlation with debt-equity ratio and tax rate. Firm size and collateral value of assets had a significant positive correlation with the ratio.
Siddiqui (2012) examined the importance of 8 factors in the capital structure decisions of Non-bank Financial Institutions in Bangladesh. It was found that factors such as debt service coverage, liquidity ratio, and growth rate, operating leverage, firm size and age of the firm had significant influences on the capital structure of Bangladeshi NBFIs.
In the paper of Jahan (2014) tangibility and profitability were found as statistically-significant in determining total debt ratio in Total Debt ratio in the Bangladeshi textile industry. Neither size nor growth rate of the company was found significant.
Ullah, Uddin, Abdullah, and Islam (2017) concluded that age and profitability of the textile companies have a significant relationship to the debt maturity of the company. Growth opportunity was not found to be insignificant.
Hossain and Ali (2012) found that profitability, tangibility, liquidity, and managerial ownership are significant in determining leverage. Their impact is negative. Growth opportunity and non-debt tax shield were significant in determining the leverage of the stock-exchange-listed companies in Bangladesh. Their impact was positive. Moreover, size, earnings volatility, and dividend payments were insignificant.
Alom (2013) found significant and negative impact of profitability, collateral and liquidity on leverage. Increased market to book value ratio increased leverage while decreased market to book value ratio reduced it. Dividend payment and size were found to be insignificant.
Hossain. and Hossain (2015) concluded that the relationship between managerial ownership and the capital structure was both significant and positive. Growth rate, profitability, debt service coverage ratio, on-debt tax shield, financial costs, free cash flow to firm, agency costs and dividend payment had a relationship with the capital structure that was both significant and negative. Higher tangibility and liquidity ratio tended to be associated with higher levels of long-term debt but with lower levels of short term debt and total debt.
Imtiaz, Mahmud, and Mallik (2016) studied the Bangladesh pharmaceutical industry, found tangibility, profitability and operating leverage to be significant (at a 1% level) in determining capital structure. Size, growth and liquidity were not found to be significant.
5. DATA and RESEARCH METHODOLOGY
5.1 Data and Variables
For constructing the panel dataset, 10 A category companies out of 35 companies listed on Dhaka Stock Exchange under textile industry have been chosen. The data were collected from 2008-2017 company annual reports of sample enterprises because of unavailability and postponing of the business operations. The independent variables in this study are profitability, asset tangibility, growth, age, liquidity, and size and the dependent variable is financial Risk. Table 1 demonstrates the operational definition of the Dependent and Independent variables.
Table-1. List of operational variables.
| Variable | Definition |
| Dependent Variable | |
| Financial Risk | Total Debt/ Total Asset |
| Independent Variables | |
| Firm Size | log(Total Asset) |
| Profitability | EBIT/Total Asset |
| Growth Rate | (Total asset current year-Total asset Previous year )/Total asset Previous year |
| Tangibility | Fixed Asset/ Total Asset |
| Liquidity | Total Current Asset/Total Current Liability |
| Age | Foundation Years |
5.2. Sampling and Sample Size
A random sampling technique was adopted to collect data. The sample size is 10. The sample size is selected through the following formula (Yamane, 1967).
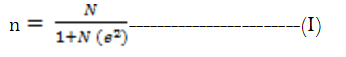
Here,
n = Sample size.
N = Population Size (Listed A category company is 35).
e = Percentage of sampling error (10%).
We put the value of population size and sampling error, than we got the sample size of 18. Among those, 10 companies are listed in DSE for 10 years. So in this study sample size is 10 listed A- category textile companies.
5.4. Model and Estimation
Multiple regression analysis has been used in the study to analyze the association between leverage ratio and a set of firm-specific variables which are profitability, tangibility, growth, age, liquidity, and size. The following equation expressed in econometric form has been developed based on the variables used in this study for conducting the test:
The result of the study was a capital structure model in which total debt ratio is a function of:
(1) Profitability.
(2) Asset tangibility.
(3) Growth.
(4) Age.
(5) Liquidity.
(6) Size of the firm:
Yit = αi + β1*Profitability + β2*Asset Tangibility + β3*Growth + β4*Age + β5*Liquidity + β5*Size + Ɛit--- (II)
Note:
i = number of companies with i= 1,2…..N.
t = number of years for which data were collected (Here, N= 10 and t = 10 [years]).
αi = Constant Value (the unknown intercept for time).
Yit = capital structure (dependent variable).
β1 to β6 all are the slopes of the independent variables of the regression.
Ɛ = Error (normally distributed error term with an assumed mean value of 0).
The independent variables were structured to minimize the likelihood of multicollinearity problem. Multicollinearity was tested by the Variance Inflation Factor or VIF method. The significance of independent variables in determining the companies’ capital structure was deduced by (panel) multiple regression analysis, using “Stata” software and considering both fixed-effect and random-effect models.
6. RESULTS AND DISCUSSION
6.1. Factors Affecting Capital Structure
These factors are the independent variables listed above, at the end of the methodology section. The study finds that these 6 factors are statistically significant in determining the capital structure, or leverage, essentially the debt-assets mix in fund-raising as defined in the Introduction section above, of a publicly-traded company in the textile industry of Bangladesh.
6.1.1. Dependent Variable
Financial Risk (Debt Ratio) has been selected as a dummy variable for the capital structure of a publicly-traded company in the Bangladesh textile industry. Many published studies have taken this approach to measure the capital structure of a company: (Janbaz, 2010; López-Gracia & Sogorb-Mira, 2008; Rajan & Zingales, 1995; Sheikh & Wang, 2010). In choosing this approach, we reject the book value of debt as a measure of capital structure, as it is comparatively outdated (Fama & French, 2002).
6.1.2. Independent Variables
Firm Size is found from this data to have a negative correlation with debt ratio, meaning that bigger firms have lower debt ratios and less leverage. This is logical, as bigger firms have more assets to use in obtaining finance without debt. Company size is measured in this study as the natural logarithm of total assets (Abor, 2008; Janbaz, 2010). This finding contradicts most of the published theories trade-off theory Titman and Wessels (1988) and, implicitly, agency cost theory posit a positive relationship between company size and leverage However, our results confirm the expectation of pecking-order theory, which predicts a negative correlation between leverage and company size, because of the lack of equal access to information between managers and outside investors as companies grow larger.
Profitability is shown by our data to have a significant and negative relationship with debt ratio. Following Titman and Wessels (1988) we have taken earnings before interest and taxes (EBIT) and divided it by the company’s total assets.
Again, our findings contradict most of what published theories would suggest. Trade off theory and the agency model indicate that leverage and profitability are positively correlated and signaling hypothesis of Ross (1977) would suggest a similar result. This study result also differs from that of Long and Malitz (1985) find the relationship between leverage and profitability not to be statistically significant. Here again, our results confirm (Myers & Majluf, 1984) pecking order theory, which suggests a negative correlation.
Growth rate is a problematic issue in the literature. However, we find it to be a statistically insignificant variable. We followed Buferna et al. (2005) in using percentage change in book value of total assets as a proxy variable for a company’s growth rate. The researchers found that each other theory takes a different view. Pecking order theory predicts a positive correlation between growth rate and leverage. , Static trade-off theory takes no position, so perhaps our finding most supports this theory. Agency cost theory concludes that there is a negative correlation between growth rate and debt level.
Tangibility of assets is found in our data not to be statistically significant. In accordance with the study of Rajan and Zingales (1995) the ratio of fixed assets to total assets is selected as a proxy for tangibility of assets.
Trade-off theory and agency cost theory say that tangibility’s relationship with debt ratio is a positive correlation. Pecking order theory arrives at the contrary conclusion, as a company with more tangible assets will have less of an information asymmetry problem with shareholders (Harris & Raviv, 1991).
Liquidity is found, in our data, to be statistically significant and has a negative correlation with leverage. We use the current assets to current liabilities ratio as a proxy for liquidity. This is a logical result, as a liquid company is, by definition, “cashed up” and does not need to borrow much.
Trade-off theory posits a positive correlation with leverage while pecking order theory posits a negative one. Again, our study supports the expectation of the pecking order theory.
Age of the firm was found, in our data, to be an insignificant variable.
Hall, Hutchinson, and Michaelas (2004) found that age was positively correlated with long-term debt but negatively correlated with short-term debt. Green, Murinde, and Suppakitjarak (2002), found that the correlation was negative with debt both of the short- and the long-term varieties.
6.2. The Multicollinearity Problem
Multicollinearity, or intercorrelation, means that the variables in the study are correlated with one another. This can mean that the data have less predictive value because the variables are not fully-independent. Using the VIF method, there would be multicollinarity if tolerance < 0.1 but VIF > 10. Table 2 shows that the selected independent variables of this study are not multicollinear. All the VIF factors are well below 10 and the mean is 1.26. Therefore, we need not be concerned about this issue, although it was necessary to test for it in order to be sure of the validity of our variables and our conclusions.
Table-2. Collinearity Statistic (VIF)
Variable |
VIF |
1/VIF |
Firm size |
1.55 |
0.647018 |
Age |
1.37 |
0.732366 |
Tangibility |
1.35 |
0.739534 |
Liquidity |
1.13 |
0.88112 |
Growth rate |
1.13 |
0.9505 |
Profitability |
1.05 |
0.9505 |
Mean VIF |
1.26 |
Table 3 reinforces this conclusion, that multicollinearity is not a problem here, by another test. This test is a direct test of correlation between independent variables. Perfect correlation is a value of 1. Thus, all the variables are correlated with themselves at a value of 1. However, all the other correlation factors are far from 1, the highest one being 0.4245. Again, we dismiss the multicollinearity issue: the problem has not arisen.
6.3. Correlation Matrix
Variable |
Financial Risk |
Firm Size |
Profitability |
Growth rate |
Tangibility |
Liquidity |
Age |
Financial Risk |
1 |
||||||
Firm Size |
-0.4229 |
1 |
|||||
Profitability |
0.0015 |
-0.1003 |
1 |
||||
Growth rate |
-0.1528 |
0.1314 |
-0.0998 |
1 |
|||
Tangibility |
0.2677 |
-0.3726 |
-0.0397 |
-0.2428 |
1 |
||
Liquidity |
-0.2291 |
0.1364 |
0.061 |
0.2451 |
-0.2556 |
1 |
|
Age |
0.2924 |
-0.4245 |
0.1793 |
-0.0329 |
-0.0777 |
0.09 |
1 |
6.4. Regular Multiple Regressions
Now we turn to the inferences which we can draw from the study. We consider the correlation of independent variables with the dependent variable. A sufficient degree of correlation means that our independent variable is significant in predicting the level of the dependent variable: it could be a factor in the decision on leverage. Then we must also consider whether it is positively-correlated (more of the independent variable yields more leverage) or negatively-correlated (more of the independent variable yields less leverage).
Table-4. Multiple Regression.
Source |
SS |
Df |
MS |
|||||
Model |
5.94730751 |
6 |
0.99121792 |
|||||
Residual |
17.6010349 |
9 |
0.18925844 |
|||||
Total |
23.5483424 |
99 |
0.23786204 |
|||||
Variables |
Coefficient |
T |
p>ItI |
|||||
Firm Size |
-0.2502801 |
-2.32 |
0.022 |
|||||
Profitability |
-0.3831479 |
-0.57 |
0.572 |
|||||
Growth Rate |
-0.0518921 |
-0.46 |
0.644 |
|||||
Tangibility |
0.3062162 |
1.28 |
0.205 |
|||||
Liquidity |
-0.0660923 |
-1.73 |
0.087 |
|||||
Age |
0.0122014 |
2.06 |
0.042 |
|||||
Cons |
2.537554 |
2.25 |
0.027 |
|||||
The R squared value becomes 0.2526. The adjusted R squared becomes 0.2043 and the root MSE becomes 0.43504. Total number of observations was 100. It indicates that among all the independent variables, the firm size, and age become significant at 5% level of significant. And the liquidity, profitability, tangibility and growth rate become significant at 10% level of significance.
Fixed Effects Model: Fixed effects model is that statistical model where model parameters are considered to be fixed/ non-random quantities. Ordinary least square method is being followed by fixed effects model. It’s found that, some companies have the highly different values while in some companies are best for their different other variables. The outcome of fixed effects model is given below:
Table-5. Fixed-Effects (within) Regression.
Fixed-Effects (within) Regression. |
||||
R-Square: |
||||
Within |
.1028 |
No. of objects |
100 |
|
Between |
.2017 |
No. of groups |
10 |
|
Overall |
.1470 |
F(5.85) |
2.05 |
|
corr(u_i, Xb) |
= 0.1217 |
Prob > F |
0.0791 |
|
Variables |
Coefficient |
T |
p>ItI |
|
Firm Size |
-.1689556 |
-0.64 |
0.525 |
|
Profitability |
-.8156639 |
-1.44 |
.152 |
|
Growth Rate |
-.1101819 |
-1.15 |
0.253 |
|
Liquidity |
-.0656663 |
-1.98 |
0.051 |
|
Age |
-.001708 |
-0.10 |
0.922 |
|
Cons |
2.436067 |
1.19 |
0.238 |
|
sigma_u |
.33093108 |
|||
sigma_e |
. 34940329 |
F(9, 85) = 7.41
Prob > F = 0.0000 |
||
rho |
.47286834 |
|||
Here R square is within 0.1028, between 0.2017, overall 0.1470 F (5.85). Prob>F=0.0791. Corr=-0.1217. It means all the independent variables can impact by 14.70% on financial risk. P value indicates that the model is significant.
Random-Effects GLS Regression: Random effects model is just the opposite of fixed effects model. Here variables are random and unpredictable. Here model parameters are considered as random. Random effects model follows GLS regression equation. The outcome of random effects model is given below:
Table-6. Random-Effects GLS Regression.
Random Effects GLS Regression |
|||
R-Square: |
|||
Within |
.1042 |
No. of objects |
100 |
Between |
.3631 |
No. of groups |
10 |
Overall |
.2348 |
Wald chi2(5) |
14.67 |
corr(u_i, Xb) |
0 |
Prob > chi2 |
0.0118 |
Variable |
Coefficient |
Z |
p>IzI |
Firm Size |
-.302624 |
-2.18 |
0.030 |
Profitability |
-.8164211 |
-1.48 |
0.100 |
Growth Rate |
-.0927495 |
-1.01 |
0.313 |
Liquidity |
-.0664912 |
-2.04 |
0.041 |
Age |
.0081479 |
0.95 |
0.340 |
Cons |
3.341806 |
2.66 |
0.008 |
sigma_u |
.28151998 |
||
sigma_e |
.34940329 |
||
Rho |
.39363768 |
Generalized Least Square regression method is being followed by random effect model because of cross sectional data. In Table 6 here R square is within 0.1042, between 0.3631, overall 0.23480. Wald chi2(5) =14.67. Prob>chi2= 0.0118. Corr=0. It means all the independent variables can impact by 23.48% on financial risk. P value 0.01 indicates that the model is not weak.
Hausman Test: Through conducting the Hausman test, we can understand between fixed effects and random effects model, which option provides the best result to our model. Here is the outcome of Hausman test:
Variables |
Fixed |
Random |
Difference |
SQRT S.E |
Firm Size |
-0.1689556 |
-0.30262 |
0.1336685 |
0.225567 |
Profitability |
-0.8156639 |
-0.81642 |
0.0007573 |
0.118001 |
Growth Rate |
-0.1101819 |
-0.09275 |
-0.0174324 |
0.02723 |
Liquidity |
-0.0656663 |
-0.06649 |
0.0008249 |
0.006312 |
Age |
-0.001708 |
0.008148 |
-0.0098559 |
0.015123 |
|
b = consistent under Ho and Ha |
chi2(5) |
2.32 |
||
| ; obtained from xtreg B = inconsistent under Ha, efficient under Ho; |
Prob>chi2 | 0.8026 | ||
Hausman fixed random reveals that difference in coefficient is not systematic (Prob>chi2=0.8026). If p > 0.05, random effects outcome is best suitable for the test. Thus random effects can be used for analysis. Table 7 reports that Wald chi2(5) = 2.32. It indicates that the perfection model has been used.
Random-effect regression analysis in Table 5 reports that there are 100 observations on company-years, reflecting N=10 companies, each observed for an average of 10 years. Besides, the P-value is also lower than 0.05, hence this also signifies liquidity, profitability and size have significant influence on dependent variable. The calculated Prob>chi2=0.0118 is less than 0.05, hence random-effects model is reported to be significant at 5% level of significance. Therefore, this study is significant and indicating that there exists significant association between capital structure and firm specific determinants of selected textile manufacturing enterprises.
7. POLICY IMPLICATIONS AND CONCLUSION
The data show, mainly from multiple regressions testing, that profitability, liquidity and asset size are statistically significant explanatory variables for Total Debt ratio, all with a negative correlation. As they are larger, borrowing is less. Other independent variables considered were not found to be significant at the .95 probability standard.
This means that the data collected here does not show sufficient correlation of the variables other than size, profitability and liquidity with the Total Debt of the companies studied here, whether or not these factors are significant in general or for other companies, to be considered influential in the decisions on Total Debt. The chi-square test further gives us confidence that there is sufficient goodness of fit to show that the correlations in the random effects model reported actually exist. In general, our findings have been most consistent with the expectations of the pecking order theory and lend some support to the accuracy of that theory. There is some support for the static trade-off theory, where the theory did not mention a variable and we did not find it to be significant, but in general the results contradict the expectations of that theory.
Therefore, it is quite likely that company managers, in large companies in the textile industry in Bangladesh, are influenced by the profitability, liquidity and size of the company, in deciding how much to borrow and how much funding to raise by selling of shares and other assets or use of own assets and cash. Other company managers can consider these results in making their decisions on these matters, as can banks considering applications for company financing and those consider purchasing company bonds and debentures. Other studies can consider other types of companies, or verify the results of this study, as well as conducting further tests on the variables not found significant here.
Funding: This study received no specific financial support. |
Competing Interests: The authors declare that they have no competing interests. |
Acknowledgement: Both authors contributed equally to the conception and design of the study. |
REFERENCES
Abor, J. (2008). Determinants of the capital structure of Ghanaian firms (pp. 1-34). AERC Research Paper 176, African Economic Research Consortium, Nairob.
Alom, K. (2013). Capital structure choice of Bangladeshi firms: An empirical investigation. Asian Journal of Finance & Accounting, 5(1), 320-333.
Baral, K. J. (2004). Determinants of capital structure: A case study of listed companies of Nepal. Journal of Nepalese Business Studies, 1(1), 1-13.
Bevan, A. A., & Danbolt, J. (2002). Capital structure and its determinants in the UK-a decompositional analysis. Applied Financial Economics, 12(3), 159-170.
Booth, L., Aivazian, V., Demirguc-Kunt, A., & Maksimovic, V. (2001). Capital structures in developing countries. The Journal of Finance, 56(1), 87-130.
Buferna, F. M., Bangassa, K., & Hodgkinson, L. (2005). Determinants of capital structure: Evidence from Libya, 2005(08) (Vol. 8). Great Bitain: University of Liverpool.
Chowdhury, M. (2004). Capital structure determinants: Evidence from Japan & Bangladesh. Journal of Business Studies, 25(1), 23-45.
Durand, D. (1952). Costs of debt and equity funds for business: trends and problems of measurement. Paper presented at the In Conference on Research in Business Finance. NBER.
Fama, E. F., & French, K. R. (2002). Testing trade-off and pecking order predictions about dividends and debt. The Review of Financial Studies, 15(1), 1-33.
Green, C. J., Murinde, V., & Suppakitjarak, J. (2002). Corporate financial structures in India. MJ Alderson, BL Betker/Journal of Financial Economics, 39(45), 69:.69.
Hall, G. C., Hutchinson, P. J., & Michaelas, N. (2004). Determinants of the capital structures of European SMEs. Journal of Business Finance & Accounting, 31(5‐6), 711-728.
Harris, M., & Raviv, A. (1991). The theory of capital structure. The Journal of Finance, 46(1), 297-355.
Hossain, F., & Ali, A. (2012). Impact of firm specific factors on capital structure decision: An empirical study of Bangladeshi Companies. International Journal of Business Research and Management, 3(4), 163-182.
Hossain., I., & Hossain, M. A. (2015). Determinants of capital structure and testing of theories: A study on the listed manufacturing companies in Bangladesh. International Journal of Economics and Finance, 7(4), 176-190.
Imtiaz, F., Mahmud, K., & Mallik, A. (2016). Determinants of capital structure and testing of applicable theories: Evidence from pharmaceutical firms of Bangladesh. International Journal of Economics and Finance, 8(3), 23-32.
Jahan, N. (2014). Determinants of capital structure of listed textile enterprises in Bangladesh. Research Journal of Finance and Accounting, 5(20), 11-20.
Janbaz, M. (2010). Capital structure decisions in the Iranian corporate sector. International Research Journal of Finance and Economics, 58(1), 24-31.
Jensen, M. C., & Meckling, W. H. (1976). Theory of the firm: Managerial behavior, agency costs and ownership structure. Journal of Financial Economics, 3(4), 305-360.
Kraus, A., & Litzenberger, R. H. (1973). A state-preference model of optimal financial leverage. The Journal of Finance, 28(4), 911-922. Available at: https://doi.org/10.1111/j.1540-6261.1973.tb01415.x.
Lima, M. (2009). An insight into the capital structure determinants of the pharmaceutical companies in Bangladesh. Paper presented at the In GBMF Conference.
Long, M., & Malitz, I. (1985). The investment-financing nexus: Some empirical evidence. Midland Corporate Finance Journal, 3(3), 53-59.
López-Gracia, J., & Sogorb-Mira, F. (2008). Testing trade-off and pecking order theories financing SMEs. Small Business Economics, 31(2), 117-136.
Mazhar, A., & Nasr, M. (2010). Determinants of capital structure decisions case of Pakistani government owned and private firms. International Review of Business Research Papers, 6(1), 40-46.
Modigliani, F., & Miller, M. H. (1958). The cost of capital, corporation finance and the theory of investment. The American Economic Review, 48(3), 261-297.
Modigliani., F., & Miller, M. H. (1963). Corporate income taxes and the cost of capital: a correction. The American Economic Review, 53(3), 433-443.
Myers, S. C., & Majluf, N. S. (1984). Corporate financing and investment decisions when firms have information that investors do not have. Journal of Financial Economics, 13(2), 187-221.
Rajan, R. G., & Zingales, L. (1995). What do we know about capital structure? Some evidence from international data. The Journal of Finance, 50(5), 1421-1460.
Ross, S. A. (1977). The determination of financial structure: The incentive-signalling approach. The Bell Journal of Economics, 8(1), 23-40. Available at: 10.2307/3003485.
Sayeed, M. A. (2011). The determinants of capital structure for selected Bangladeshi listed companies. International Review of Business Research Papers, 7(2), 21-36.
Shah, & Hijazi. (2004). The determinants of capital structure of stock exchange-listed non-financial firms in Pakistan. The Pakistan Development Review, 43(4), 605–661.
Sheikh, N. A., & Wang, Z. (2010). Financing behavior of textile firms in Pakistan. International Journal of Innovation, Management and Technology, 1(2), 130-135.
Siddiqui, S. S. (2012). Capital structure determinants of non-bank financial institutions (NBFIs) in Bangladesh. World Review of Business Research, 2(1), 60-78.
Solomon, E. (1963). Leverage and the cost of capital. The Journal of Finance, 18(2), 273-279.
Titman, S., & Wessels, R. (1988). The determinants of capital structure choice. The Journal of Finance, 43(1), 1-19.
Ullah, G., Uddin, M., Abdullah, M., & Islam, M. (2017). Determinants of capital structure and its impact on the debt maturity of the textile industry of Bangladesh. Journal of Business and Economic Development, 2(1), 31-37.
Vasiliou, D., Daskalakis, N., & Eriotis, N. (2006). Investigating the capital structure og Greek firms: Some preliminary evidence. 207-232.
Yamane, T. (1967). Elementary sampling theory.
Views and opinions expressed in this article are the views and opinions of the author(s), Financial Risk and Management Reviews shall not be responsible or answerable for any loss, damage or liability etc. caused in relation to/arising out of the use of the content. |